The Basel Problem
The Basel Problem and Its Solution
$$ \sum_{n=1}^{\infty} \frac{1}{n^2} = \frac{\pi^2}{6} $$
Convergence
It was known early on that this infinite series converges.
$$ \sum_{n=1}^{N} \frac{1}{n^2} \le 1 + \sum_{n=2}^{N} \frac{1}{n(n-1)} = 1 + \sum_{n=2}^{N} (\frac{1}{n-1} - \frac{1}{n}) = 1 + (1 - \frac{1}{N}) \le 2 $$
Thus, it is shown to be a bounded and monotonically increasing sequence.
Euler’s Solution
Euler solved this problem through the idea of factoring the sine function.
Since $\sin{x}$ is zero at $x = 0, \pm \pi, \pm 2 \pi, \ldots \pm n \pi, \ldots$, and $\sin{x} \sim x$ near $x=0$, it can be formally factored as follows:
$$ \sin{x} = x (1 - \frac{x^2}{\pi^2}) (1 - \frac{x^2}{2^2\pi^2}) … (1 - \frac{x^2}{n^2\pi^2}) … $$
Expanding the right-hand side:
$$ \sin{x} = x \{ 1 - (\frac{1}{\pi^2} + \frac{1}{2^2\pi^2} + … + \frac{1}{n^2\pi^2} + …) x^2 + … \} $$
On the other hand, the Maclaurin series expansion is:
$$ \sin{x} = x - \frac{x^3}{3!} + \frac{x^5}{5!} + … $$
By comparing the coefficients of $x^3$, we get:
$$ \frac{1}{\pi^2} + \frac{1}{2^2\pi^2} + … = \frac{1}{3!} $$
Multiplying both sides by $\pi^2$, we obtain:
$$ \frac{1}{1^2} + \frac{1}{2^2} + … = \frac{\pi ^ 2}{6} $$
Although it is a bold method, this argument is justified in modern times.
Convergence Behavior
The convergence behaves as follows. It is not rapid.
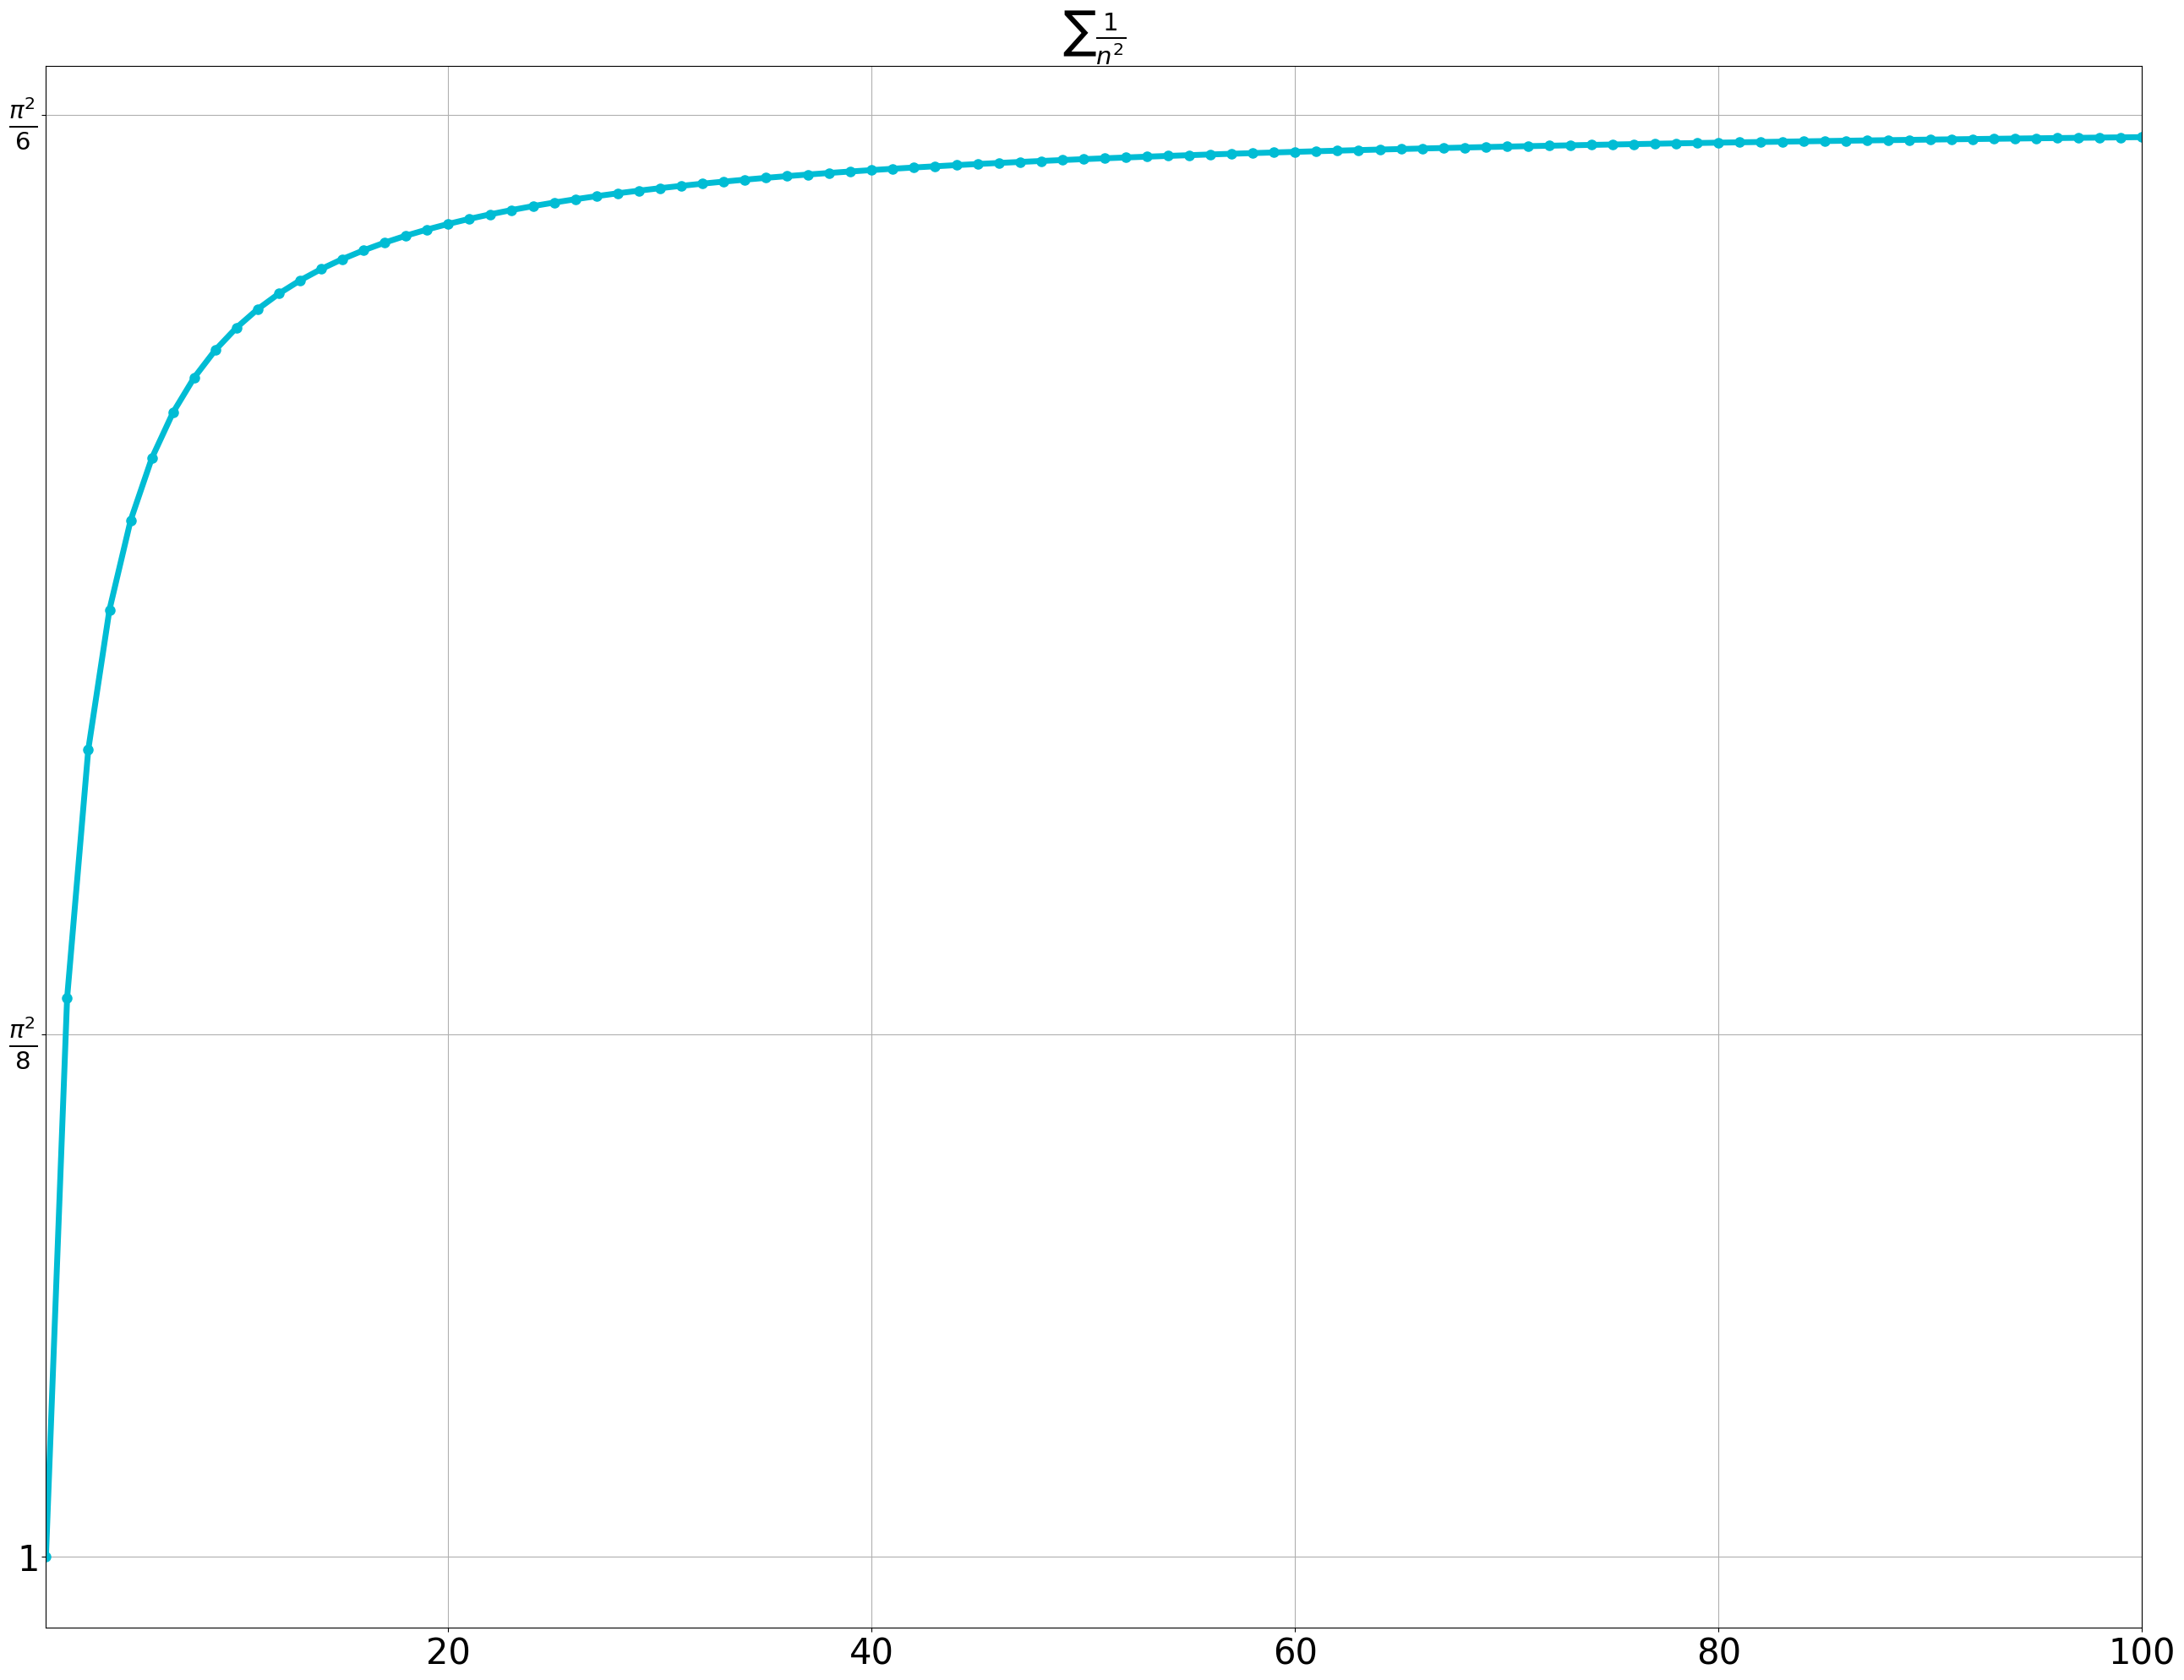
The Python code used to generate this plot is as follows:
#! /usr/bin/env python

import numpy as np
from matplotlib import pyplot as plt

plt.rcParams["figure.figsize"] = (32.0, 24.0)
plt.rcParams["lines.markersize"] = 2

a = np.arange(1, 101)

b = 1 / a**2

c = np.cumsum(b)

lim = np.pi ** 2 / 6

plt.title(r"$\sum{\frac{1}{n^2}}$", fontsize=30)
plt.plot(a, c, marker="o", lw=5, color="#00BCD4", markersize=8)

plt.yticks(
    [1, lim * 3 / 4, lim],
    [r"$1$", r"$\frac{\pi^2}{8}$", r"$\frac{\pi^2}{6}$"],
    fontsize=30,
)
plt.xticks(fontsize=30)
plt.xlim([1, 100])
plt.grid()

plt.savefig("basel-problem.png", bbox_inches="tight", transparent=True)
Behavior of Convergence of the Infinite Product Expansion of the Sine Function
Euler’s Factorization
$$ \sin{x} = x (1 - \frac{x^2}{\pi^2}) (1 - \frac{x^2}{2^2\pi^2}) … (1 - \frac{x^2}{n^2\pi^2}) … $$
The behavior of convergence is as follows:
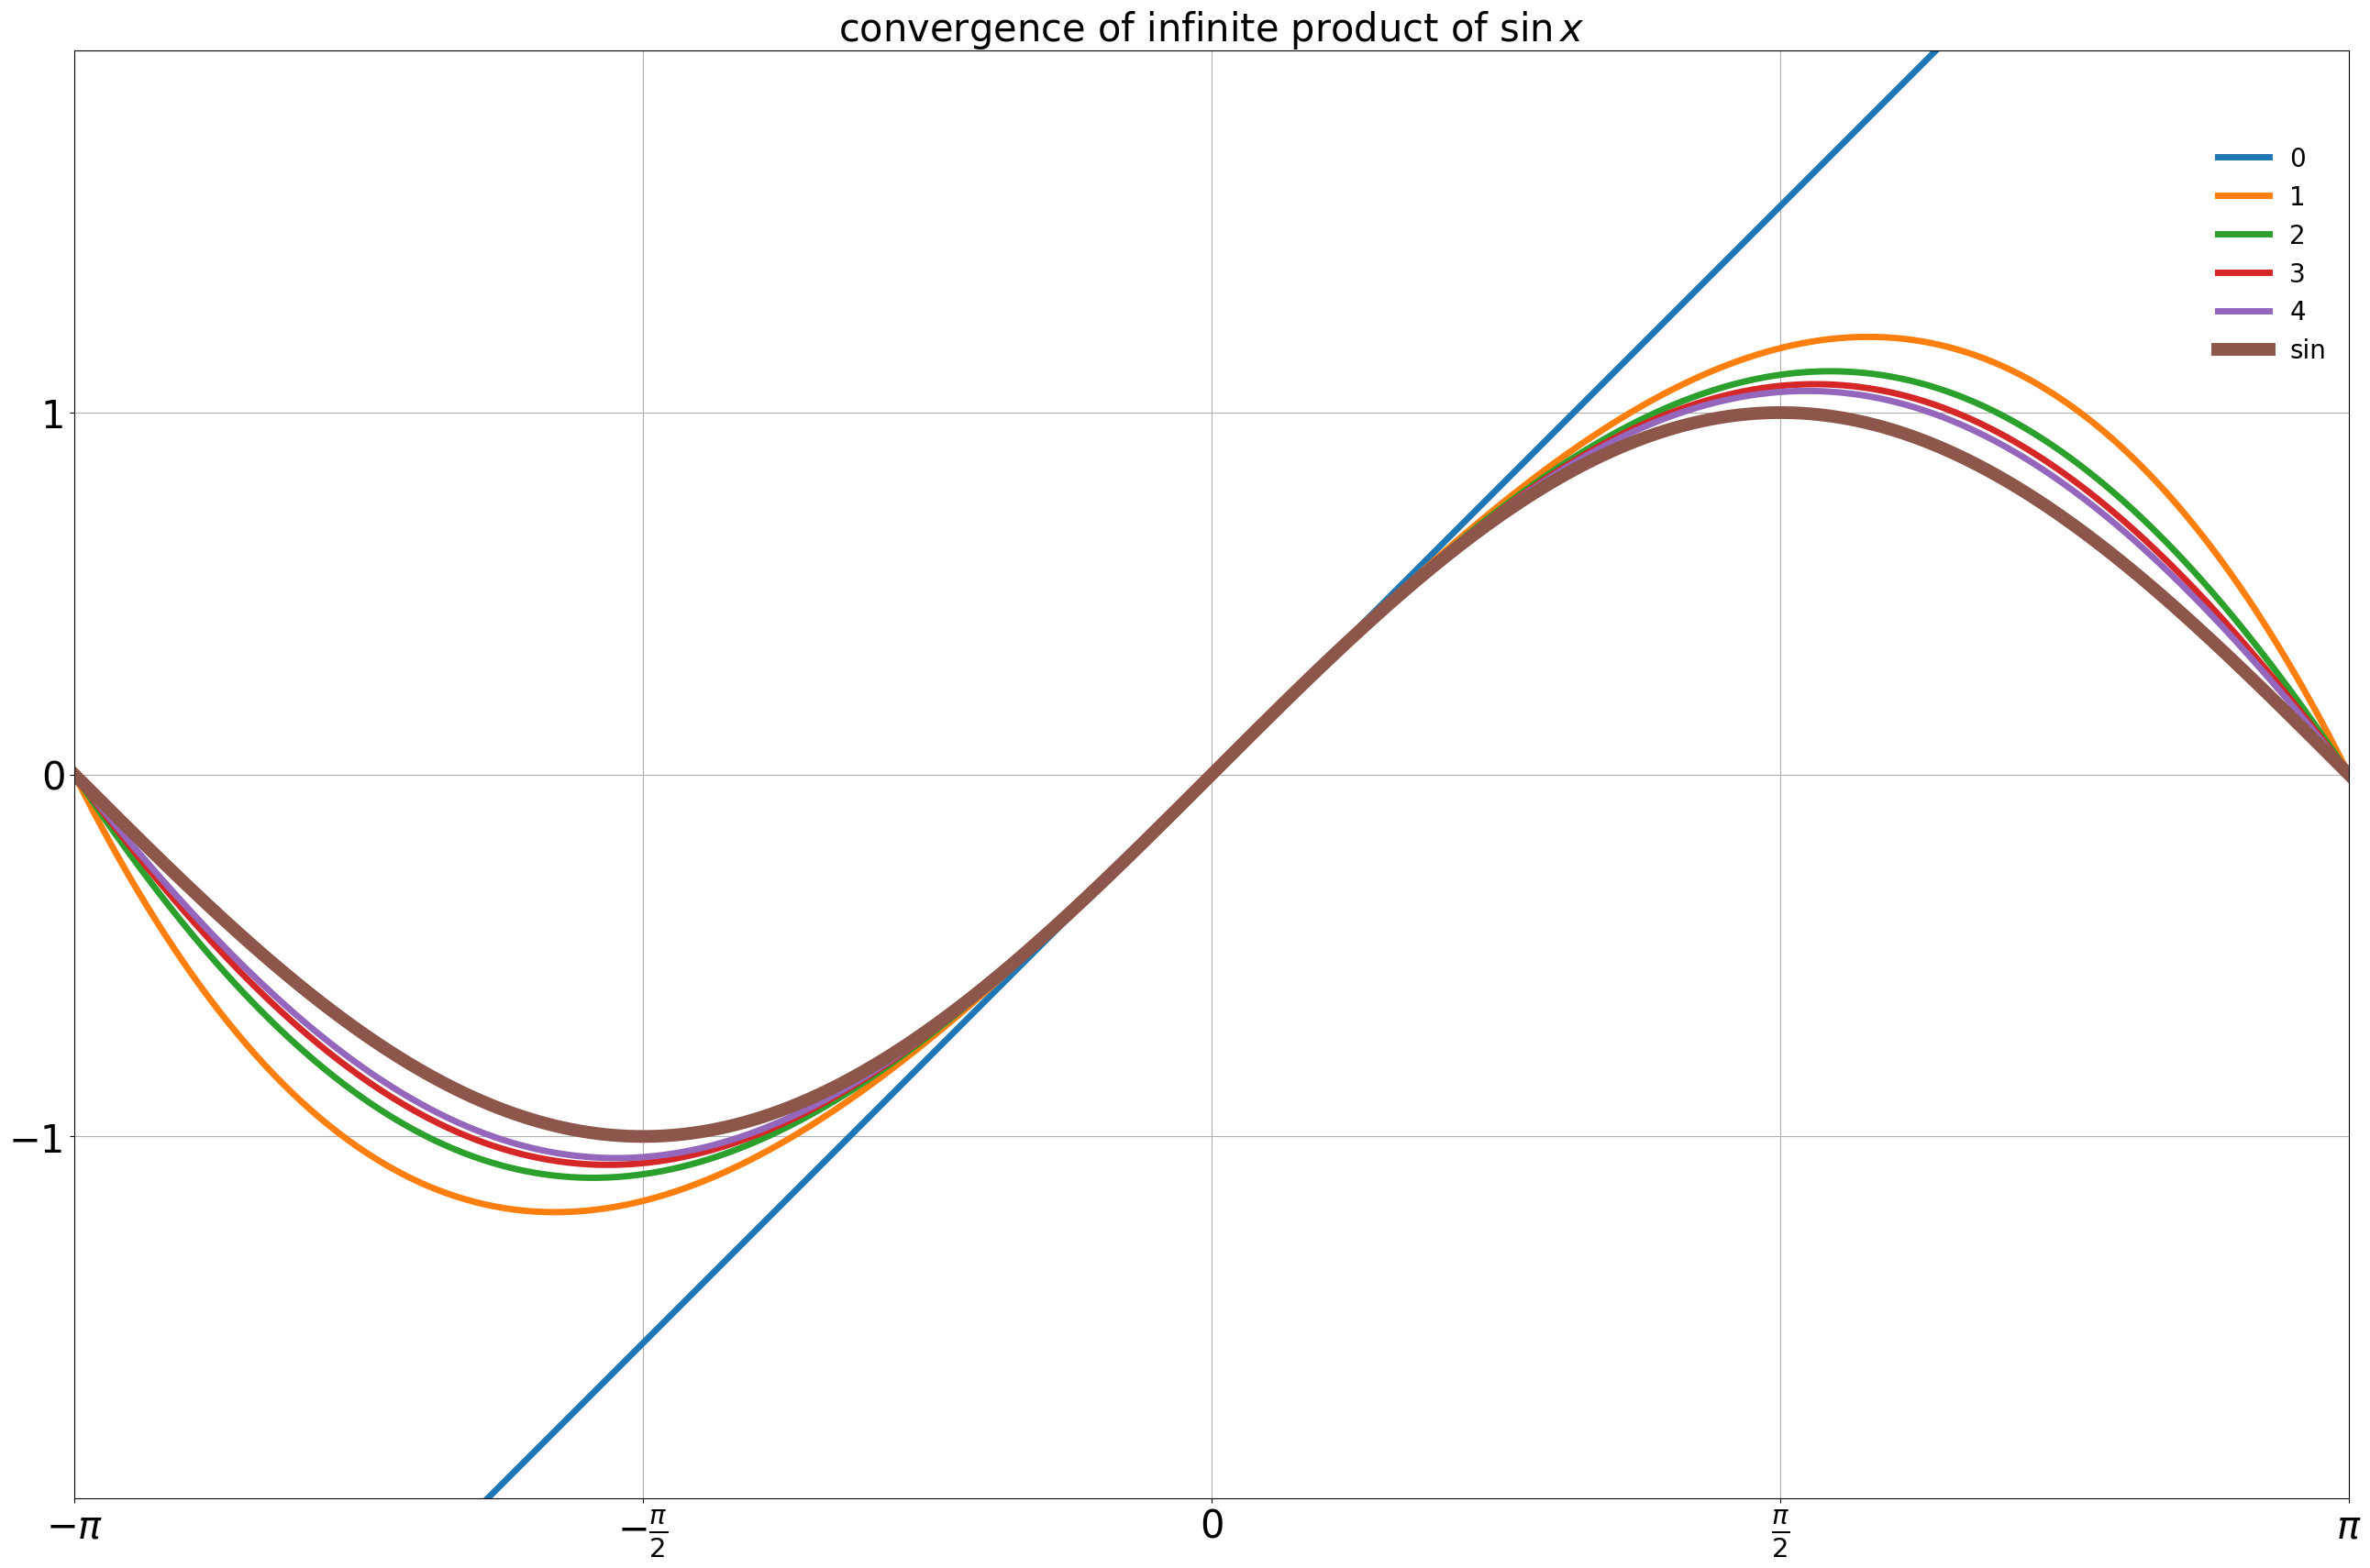
The Python code used to generate this figure is as follows:
#! /usr/bin/env python

import numpy as np
from matplotlib import pyplot as plt

plt.rcParams["figure.figsize"] = (32.0, 24.0)
plt.rcParams["lines.markersize"] = 2


plt.title(r"convergence of infinite product of $\sin{x}$", fontsize=30)

for i in range(5):

    def f(x):
        y = x.copy()
        for j in range(1, i + 1):
            y *= 1 - x**2 / (j**2 * np.pi**2)
        return y

    a = np.linspace(-np.pi, np.pi, 500)
    b = f(a)
    plt.plot(a, b, label=f"{i}", lw=5)

a = np.linspace(-np.pi, np.pi, 500)
b = np.sin(a)
plt.plot(a, b, label="sin", lw=10)


plt.yticks([-1, 0, 1], fontsize=30)
plt.xticks(
    [-np.pi, -np.pi / 2, 0, np.pi / 2, np.pi],
    [r"$-\pi$", r"$-\frac{\pi}{2}$", "0", r"$\frac{\pi}{2}$", r"$\pi$"],
    fontsize=30,
)
plt.legend(fontsize=20, framealpha=0.0, bbox_to_anchor=(1.0, 0.95))
plt.grid()
plt.axis("scaled")
plt.xlim([-np.pi, np.pi])
plt.ylim([-2, 2])

plt.savefig("basel-problem-inf-prod-sin.png", bbox_inches="tight", transparent=True)